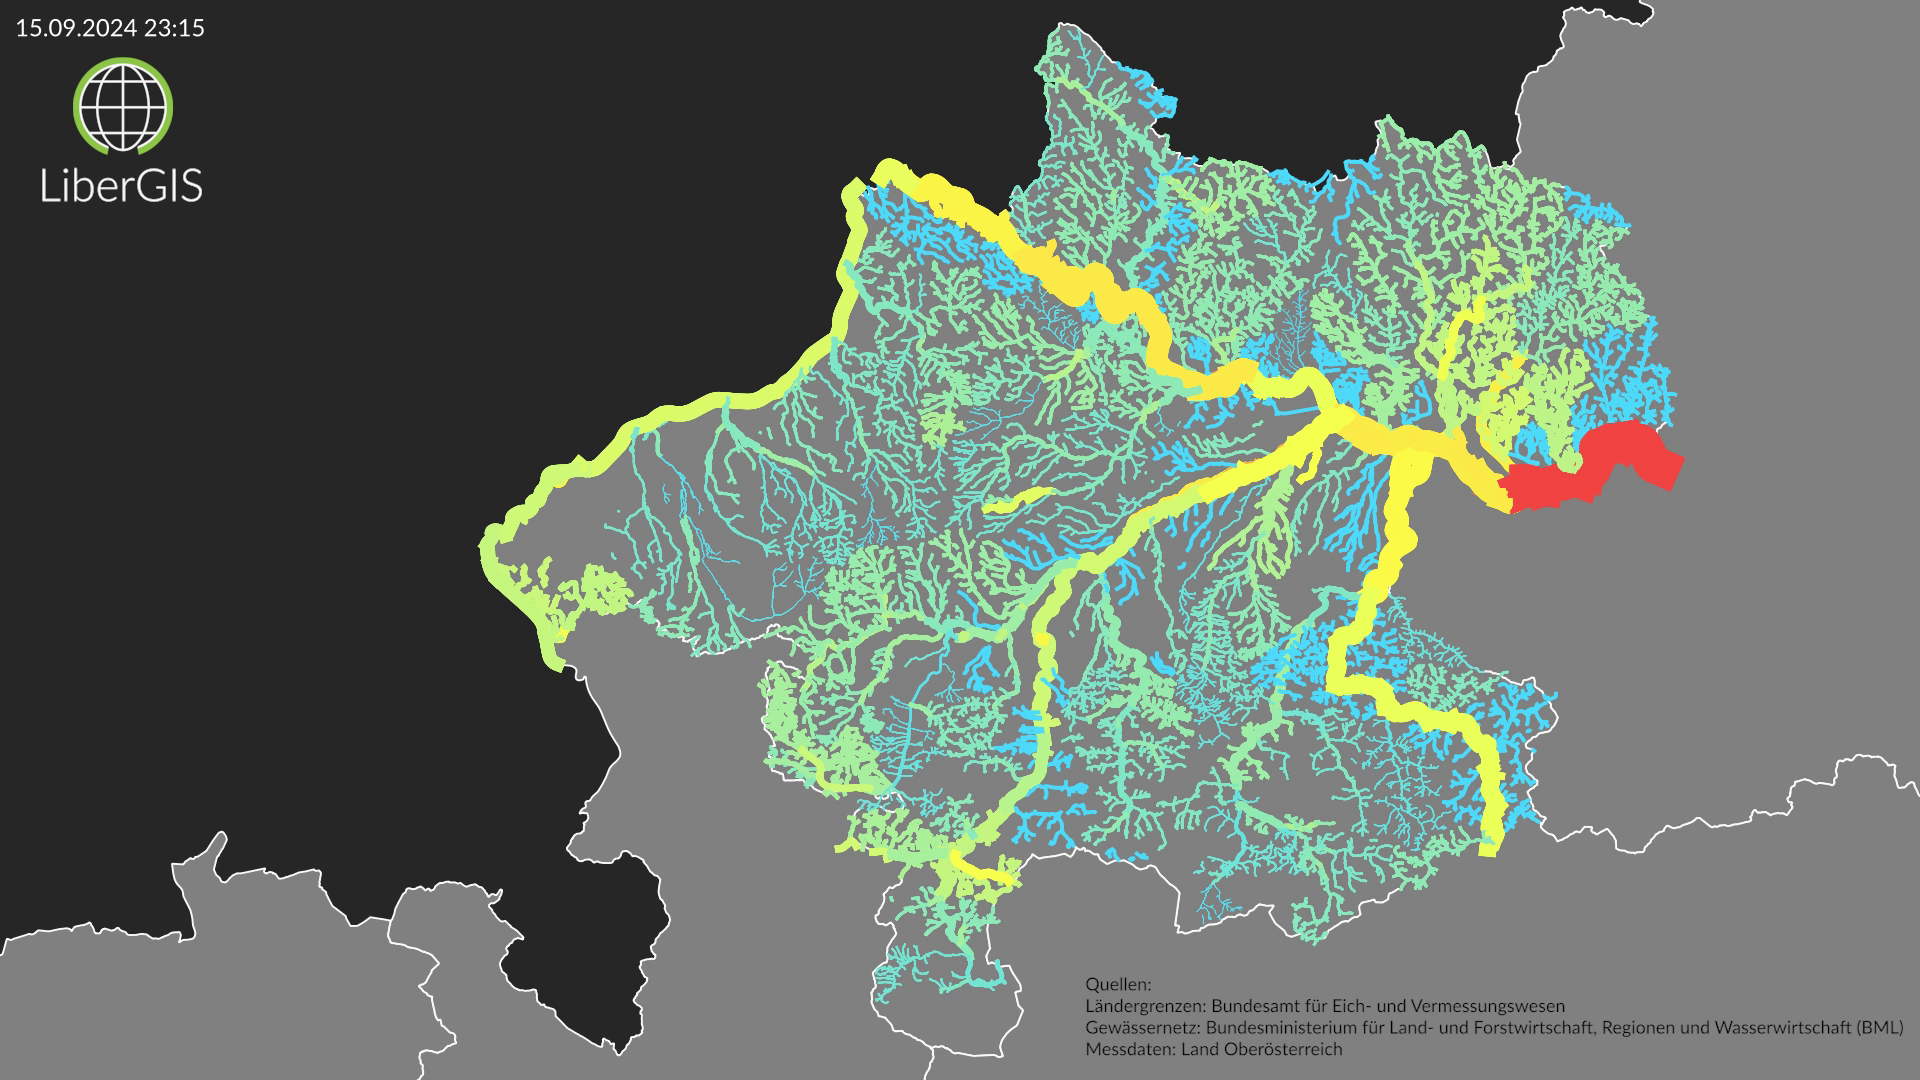
The floods in September 2024 were one of the most dramatic weather events I can remember, especially in northeastern Austria. Despite early warnings, severe damage was caused. There have also been warnings for a long time that such disasters will become more frequent.
Forecasts only work on the basis of data. And fortunately, we are getting more and more data – and it is also openly available!
As fun exercise, I downloaded the measuring gauges in Upper Austria from September 12th to 18th as Open Government Data (OGD) and combined them with the water network. This gave me a rough value of the water level for most of the rivers in Upper Austria at 15-minute intervals. I then visualized these values in QGIS (the height of the value determines the color and line thickness) and exported them. The result gives an exciting impression of the development of the water levels during these dramatic days.
The Video can be seen here: https://youtu.be/RsP-3H_jpfc

